Unknown entries from news log file:
First 4 / 4 lines (100.0%)
Log entries by program:
| Program name | Lines | %Lines | Size | %Size |
|---|---|---|---|---|
| inn | 144050 | 78.2% | 15.9 MB | 80.8% |
| innd | 23054 | 12.5% | 2.2 MB | 11.0% |
| nnrpd | 15712 | 8.5% | 1.5 MB | 7.4% |
| innfeed | 1268 | 0.7% | 143.4 KB | 0.7% |
| controlchan | 46 | 0.0% | 10.0 KB | 0.0% |
| pgpverify | 4 | 0.0% | 0.5 KB | 0.0% |
| overchan | 2 | 0.0% | 0.3 KB | 0.0% |
| TOTAL: 7 | 184136 | 100.0% | 19.7 MB | 100.0% |
History cache:
| Reason | Count | %Count |
|---|---|---|
| Do not exist | 287094 | 99.6% |
| Negative hits | 1002 | 0.3% |
| Positive hits | 116 | 0.0% |
| Cache misses | 10 | 0.0% |
| TOTAL: 4 | 288222 | 100.0% |
INND timer:
| Code region | Time | Pct | Invoked | Min(ms) | Avg(ms) | Max(ms) |
|---|---|---|---|---|---|---|
| article cancel | 00:00:00.028 | 0.0% | 84 | 0.000 | 0.333 | 3.000 |
| article cleanup | 00:00:00.748 | 0.0% | 289344 | 0.000 | 0.003 | 0.008 |
| article logging | 00:00:03.224 | 0.0% | 289404 | 0.002 | 0.011 | 0.023 |
| article parse | 00:00:05.642 | 0.0% | 1082020 | 0.003 | 0.005 | 0.008 |
| article write | 00:00:08.514 | 0.0% | 289340 | 0.012 | 0.029 | 0.062 |
| artlog/artcncl | 00:00:00.000 | 0.0% | 24 | 0.000 | 0.000 | 0.000 |
| data move | 00:00:01.044 | 0.0% | 1573602 | 0.000 | 0.001 | 0.004 |
| hisgrep/artcncl | 00:00:00.002 | 0.0% | 108 | 0.000 | 0.019 | 0.250 |
| hishave/artcncl | 00:00:00.000 | 0.0% | 24 | 0.000 | 0.000 | 0.000 |
| history grep | 00:00:00.000 | 0.0% | 0 | 0.000 | 0.000 | 0.000 |
| history lookup | 00:00:00.996 | 0.0% | 290448 | 0.000 | 0.003 | 0.023 |
| history sync | 00:00:00.008 | 0.0% | 608 | 0.000 | 0.013 | 0.500 |
| history write | 00:00:15.148 | 0.0% | 289340 | 0.018 | 0.052 | 0.132 |
| idle | 47:55:48.412 | 99.8% | 1307576 | 70.392 | 131.961 | 310.371 |
| nntp read | 00:00:08.378 | 0.0% | 1042718 | 0.005 | 0.008 | 0.014 |
| overview write | 00:00:00.408 | 0.0% | 289340 | 0.000 | 0.001 | 0.005 |
| perl filter | 00:02:28.084 | 0.1% | 289340 | 0.332 | 0.512 | 0.773 |
| python filter | 00:00:00.056 | 0.0% | 289340 | 0.000 | 0.000 | 0.002 |
| site send | 00:00:04.018 | 0.0% | 597224 | 0.002 | 0.007 | 0.013 |
| TOTAL: 48:00:34.160 | 47:59:04.710 | 99.9% | - | - | - | - |
INNfeed timer:
| Code region | Time | Pct | Invoked | Min(ms) | Avg(ms) | Max(ms) |
|---|---|---|---|---|---|---|
| article new | 00:00:00.046 | 0.0% | 18520 | 0.000 | 0.002 | 0.034 |
| article prepare | 00:00:00.000 | 0.0% | 1344 | 0.000 | 0.000 | 0.000 |
| article read | 00:00:00.004 | 0.0% | 336 | 0.000 | 0.012 | 1.000 |
| backlog stats | 00:00:00.016 | 0.0% | 104150 | 0.000 | 0.000 | 0.005 |
| callbacks | 00:00:00.000 | 0.0% | 0 | 0.000 | 0.000 | 0.000 |
| data read | 00:00:00.320 | 0.0% | 51898 | 0.000 | 0.006 | 0.029 |
| data write | 00:00:00.776 | 0.0% | 32434 | 0.000 | 0.024 | 0.117 |
| idle | 47:57:38.314 | 100.0% | 104150 | 796.093 | 1657.785 | 3597.701 |
| status file | 00:00:00.146 | 0.0% | 338 | 0.000 | 0.432 | 3.000 |
| TOTAL: 47:57:40.358 | 47:57:39.622 | 100.0% | - | - | - | - |
nnrpd timer:
| Code region | Time | Pct | Invoked | Min(ms) | Avg(ms) | Max(ms) |
|---|---|---|---|---|---|---|
| idle | 00:01:53.176 | 75.0% | 8732 | 1.000 | 12.961 | 10050.000 |
| newnews | 00:00:00.000 | 0.0% | 0 | 0.000 | 0.000 | 0.000 |
| nntpwrite | 00:00:00.242 | 0.2% | 29692 | 0.000 | 0.008 | 0.333 |
| readart | 00:00:00.000 | 0.0% | 8 | 0.000 | 0.000 | 0.000 |
| TOTAL: 00:02:30.926 | 00:01:53.418 | 75.1% | - | - | - | - |
Control commands to INND:
| Command | Number |
|---|---|
| flush | 54 |
| flushlogs | 4 |
| go | 4 |
| logmode | 4 |
| lowmark | 2 |
| mode | 296 |
| name | 4 |
| pause | 4 |
| paused | 4 |
| reload | 4 |
| reserve | 4 |
| TOTAL: 11 | 384 |
Control Channel:
| Sender | newgroup | rmgroup | Other | Bad PGP | DoIt | OK |
|---|---|---|---|---|---|---|
| group-admin@isc.org | 0 | 0 | 4 | 4 | 0 | 4 |
| TOTAL | 0 | 0 | 4 | 4 | 0 | 4 |
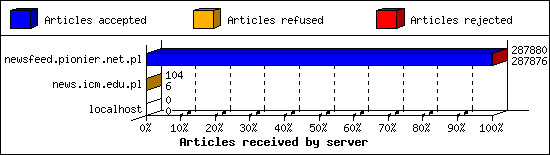
Incoming Feeds (INN):
| Server | Connects | Offered | Taken | Refused | Reject | %Accpt | Elapsed | |
|---|---|---|---|---|---|---|---|---|
| 1 | newsfeed.pionier.net.pl | 114 | 287880 | 287876 | 0 | 4 | 99% | 68:36:32 |
| 2 | news.icm.edu.pl | 58 | 104 | 6 | 98 | 0 | 5% | 13:00:56 |
| 3 | localhost | 2 | 0 | 0 | 0 | 0 | 0% | 00:00:00 |
| TOTAL: 3 | 174 | 287984 | 287882 | 98 | 4 | 99% | 81:37:28 | |
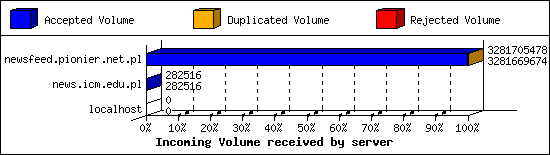
Incoming Volume (INN):
| Server | AcceptVol | DupVol | RejVol | TotalVol | %Acc | Vol/Art | |
|---|---|---|---|---|---|---|---|
| 1 | newsfeed.pionier.net.pl | 3.1 GB | 35.0 KB | 0.0 KB | 3.1 GB | 99% | 11.1 KB |
| 2 | news.icm.edu.pl | 275.9 KB | 0.0 KB | 0.0 KB | 275.9 KB | 100% | 46.0 KB |
| 3 | localhost | 0.0 KB | 0.0 KB | 0.0 KB | 0.0 KB | 0% | 0 |
| TOTAL: 3 | 3.1 GB | 35.0 KB | 0.0 KB | 3.1 GB | 99% | 11.1 KB | |
Incoming articles:
| Date | Articles | %Arts | Art/sec | Size | %Size | KB/sec |
|---|---|---|---|---|---|---|
| Nov 15 04:15:01 - 04:59:59 | 3444 | 2.4% | 1.28 | 39.7 MB | 2.5% | 15.06 |
| Nov 15 05:00:00 - 05:59:59 | 4930 | 3.4% | 1.37 | 54.3 MB | 3.5% | 15.44 |
| Nov 15 06:00:00 - 06:59:59 | 3903 | 2.7% | 1.08 | 40.1 MB | 2.6% | 11.41 |
| Nov 15 07:00:00 - 07:59:59 | 4120 | 2.9% | 1.14 | 43.4 MB | 2.8% | 12.34 |
| Nov 15 08:00:00 - 08:59:59 | 4311 | 3.0% | 1.20 | 51.7 MB | 3.3% | 14.72 |
| Nov 15 09:00:00 - 09:59:59 | 6699 | 4.7% | 1.86 | 74.9 MB | 4.8% | 21.30 |
| Nov 15 10:00:00 - 10:59:59 | 5988 | 4.2% | 1.66 | 68.8 MB | 4.4% | 19.58 |
| Nov 15 11:00:00 - 11:59:59 | 6850 | 4.8% | 1.90 | 71.7 MB | 4.6% | 20.38 |
| Nov 15 12:00:00 - 12:59:59 | 8926 | 6.2% | 2.48 | 94.4 MB | 6.0% | 26.86 |
| Nov 15 13:00:00 - 13:59:59 | 7906 | 5.5% | 2.20 | 83.6 MB | 5.3% | 23.77 |
| Nov 15 14:00:00 - 14:59:59 | 8001 | 5.6% | 2.22 | 76.7 MB | 4.9% | 21.82 |
| Nov 15 15:00:00 - 15:59:59 | 7613 | 5.3% | 2.11 | 87.4 MB | 5.6% | 24.87 |
| Nov 15 16:00:00 - 16:59:59 | 6335 | 4.4% | 1.76 | 74.1 MB | 4.7% | 21.07 |
| Nov 15 17:00:00 - 17:59:59 | 6090 | 4.2% | 1.69 | 79.0 MB | 5.0% | 22.47 |
| Nov 15 18:00:00 - 18:59:59 | 6284 | 4.4% | 1.75 | 73.8 MB | 4.7% | 21.00 |
| Nov 15 19:00:00 - 19:59:59 | 5993 | 4.2% | 1.66 | 61.1 MB | 3.9% | 17.39 |
| Nov 15 20:00:00 - 20:59:59 | 7247 | 5.0% | 2.01 | 79.2 MB | 5.1% | 22.53 |
| Nov 15 21:00:00 - 21:59:59 | 4968 | 3.4% | 1.38 | 52.3 MB | 3.3% | 14.87 |
| Nov 15 22:00:00 - 22:59:59 | 6488 | 4.5% | 1.80 | 60.2 MB | 3.8% | 17.12 |
| Nov 15 23:00:00 - 23:59:59 | 6721 | 4.7% | 1.87 | 73.6 MB | 4.7% | 20.95 |
| Nov 16 00:00:00 - 00:59:59 | 5459 | 3.8% | 1.52 | 59.9 MB | 3.8% | 17.05 |
| Nov 16 01:00:00 - 01:59:59 | 5710 | 4.0% | 1.59 | 63.9 MB | 4.1% | 18.18 |
| Nov 16 02:00:00 - 02:59:59 | 4454 | 3.1% | 1.24 | 43.5 MB | 2.8% | 12.39 |
| Nov 16 03:00:00 - 03:59:59 | 4670 | 3.2% | 1.30 | 47.9 MB | 3.1% | 13.61 |
| Nov 16 04:00:00 - 04:15:01 | 896 | 0.6% | 0.99 | 10.3 MB | 0.7% | 11.72 |
| TOTAL: 24:00:00 | 144006 | 100.0% | 1.67 | 1.5 GB | 100.0% | 18.56 |


Sites sending bad articles:
| Server | Total | Group | Dist | Duplic | Unapp | TooOld | Site | Line | Other | |
|---|---|---|---|---|---|---|---|---|---|---|
| 1 | newsfeed.pionier.net.pl | 32 | 0 | 0 | 2 | 0 | 0 | 0 | 0 | 30 |
| TOTAL: 1 | 32 | 0 | 0 | 2 | 0 | 0 | 0 | 0 | 30 | |
Miscellaneous innd statistics [Top 10]:
| Event | Server | Number |
|---|---|---|
| Including strange strings | ||
| newsfeed.pionier.net.pl | 30 | |
| TOTAL: 1 | 30 | |
| TOTAL: 1 | 30 | |
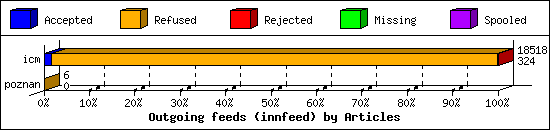
Outgoing Feeds (innfeed) by Articles:
| Server | Offered | Taken | Refused | Reject | Miss | Spool | %Took | Elapsed | |
|---|---|---|---|---|---|---|---|---|---|
| 1 | icm | 34810 | 324 | 18182 | 12 | 0 | 0 | 0% | 47:59:56 |
| 2 | poznan | 8 | 0 | 6 | 0 | 0 | 0 | 0% | 01:20:10 |
| TOTAL: 2 | 34818 | 324 | 18188 | 12 | 0 | 0 | 0% | 49:20:06 | |
Outgoing Feeds (innfeed) by Volume:
| Server | AcceptVol | RejectVol | TotalVol | Volume/sec | Vol/Art | Elapsed | |
|---|---|---|---|---|---|---|---|
| 1 | icm | 452.1 KB | 132.2 KB | 584.3 KB | 0.0 KB/s | 1.7 KB | 47:59:56 |
| 2 | poznan | 0.0 KB | 0.0 KB | 0.0 KB | 0.0 KB/s | 0 | 01:20:10 |
| TOTAL: 2 | 452.1 KB | 132.2 KB | 584.3 KB | 0.0 KB/s | 1.7 KB | 49:20:06 | |

NNRP readership statistics:
| System | Conn | Arts | Size | Groups | Post | Rej | Elapsed | |
|---|---|---|---|---|---|---|---|---|
| 1 | 172.16.2.4 | 576 | 8 | 11.5 KB | 4 | 0 | 0 | 00:00:33 |
| TOTAL: 1 | 576 | 8 | 11.5 KB | 4 | 0 | 0 | 00:02:31 | |
NNRP readership statistics (by domain):
| System | Conn | Arts | Size | Groups | Post | Rej | Elapsed | |
|---|---|---|---|---|---|---|---|---|
| 1 | unresolved | 592 | 8 | 11.5 KB | 4 | 0 | 0 | 00:01:01 |
| 2 | *.probe.onyphe.net | 4 | 0 | 0.0 KB | 0 | 0 | 0 | 00:00:08 |
| 3 | *.ch1.censys-scanner.com | 6 | 0 | 0.0 KB | 0 | 0 | 0 | 00:00:17 |
| 4 | *.stretchoid.com | 8 | 0 | 0.0 KB | 0 | 0 | 0 | 00:00:40 |
| 5 | *.man.lodz.pl | 2880 | 0 | 0.0 KB | 0 | 0 | 0 | 00:00:23 |
| TOTAL: 5 | 3490 | 8 | 11.5 KB | 4 | 0 | 0 | 00:02:31 | |
NNRP total resource statistics [Top 20]:
| System | User(ms) | System(ms) | Idle(ms) | Elapsed |
|---|---|---|---|---|
| 172.16.2.4 | 1.256 | 2.740 | 0.000 | 00:00:33 |
| nms1.man.lodz.pl | 5.696 | 12.966 | 0.000 | 00:00:23 |
| azpdssz6szk7.stretchoid.com | 0.008 | 0.030 | 0.000 | 00:00:20 |
| azpdcsyi9p1a.stretchoid.com | 0.010 | 0.016 | 0.000 | 00:00:20 |
| 80.111.142.213 | 0.016 | 0.042 | 0.000 | 00:00:18 |
| scanner-201.ch1.censys-scanner.com | 0.068 | 0.032 | 0.000 | 00:00:17 |
| ameera.probe.onyphe.net | 0.004 | 0.010 | 0.000 | 00:00:06 |
| 198.235.24.8 | 0.004 | 0.008 | 0.000 | 00:00:05 |
| 207.90.244.28 | 0.006 | 0.006 | 0.000 | 00:00:02 |
| rocha.probe.onyphe.net | 0.002 | 0.012 | 0.000 | 00:00:01 |
| 205.210.31.46 | 0.004 | 0.008 | 0.000 | 00:00:01 |
| 205.210.31.245 | 0.000 | 0.014 | 0.000 | 00:00:00 |
| TOTAL: 12 | 7.074 | 15.884 | 0.000 | 00:02:31 |
Curious NNRP server explorers [Top 20]:
| System | Conn |
|---|---|
| nms1.man.lodz.pl | 2880 |
| 80.111.142.213 | 8 |
| scanner-201.ch1.censys-scanner.com | 6 |
| azpdcsyi9p1a.stretchoid.com | 4 |
| azpdssz6szk7.stretchoid.com | 4 |
| rocha.probe.onyphe.net | 2 |
| 207.90.244.28 | 2 |
| 205.210.31.245 | 2 |
| 198.235.24.8 | 2 |
| 205.210.31.46 | 2 |
| ameera.probe.onyphe.net | 2 |
| TOTAL: 11 | 2914 |
NNRP unrecognized commands (by host) [Top 20]:
| System | Conn |
|---|---|
| rocha.probe.onyphe.net | 4 |
| scanner-201.ch1.censys-scanner.com | 2 |
| azpdssz6szk7.stretchoid.com | 2 |
| azpdcsyi9p1a.stretchoid.com | 2 |
| TOTAL: 4 | 10 |
NNRP unrecognized commands (by command) [Top 20]:
| Command | Count |
|---|---|
| MGLNDD_212.191.2.21_119 | 4 |
| #026#003#003#001¥#001 | 2 |
| À$ÀÀ¯À,ÀrÀsÌ©#023#002#023#001Ì#024À#007À#022À#023À'À/À#024À(À0À`Àa... | 2 |
| EHLO www.censys.io | 2 |
| TOTAL: 4 | 10 |
NNRP client timeouts [Top 20]:
| System | Conn | Peer |
|---|---|---|
| scanner-201.ch1.censys-scanner.com | 2 | 4 |
| TOTAL: 1 | 2 | 10 |
Newsgroup request counts (by hierarchy):
| Hierarchy | Count | Pct | |
|---|---|---|---|
| 1 | pl | 8 | 100.0% |
| TOTAL: 1 | 8 | 100.0% | |
Newsgroup request counts (by newsgroup) [Top 100]:
| Newsgroup | Count | |
|---|---|---|
| 1 | pl.comp.pecet | 8 |
| TOTAL: 1 | 8 | |